
Traffic Lab
A browser-based load-balancing simulator that compares direct-to-backend traffic with a round-robin balancer under normal, burst, and overload scenarios.
Stack
Tags
Why I built it
I built Traffic Lab because load balancing is easier to understand when request pressure exceeds backend capacity. I wanted a small visual experiment instead of a static explanation.
The simulator compares two modes: sending traffic directly to backend instances and distributing requests through a balancer. I kept the purpose educational: show queueing, saturation, latency, and dropped requests with immediate feedback.
What it does
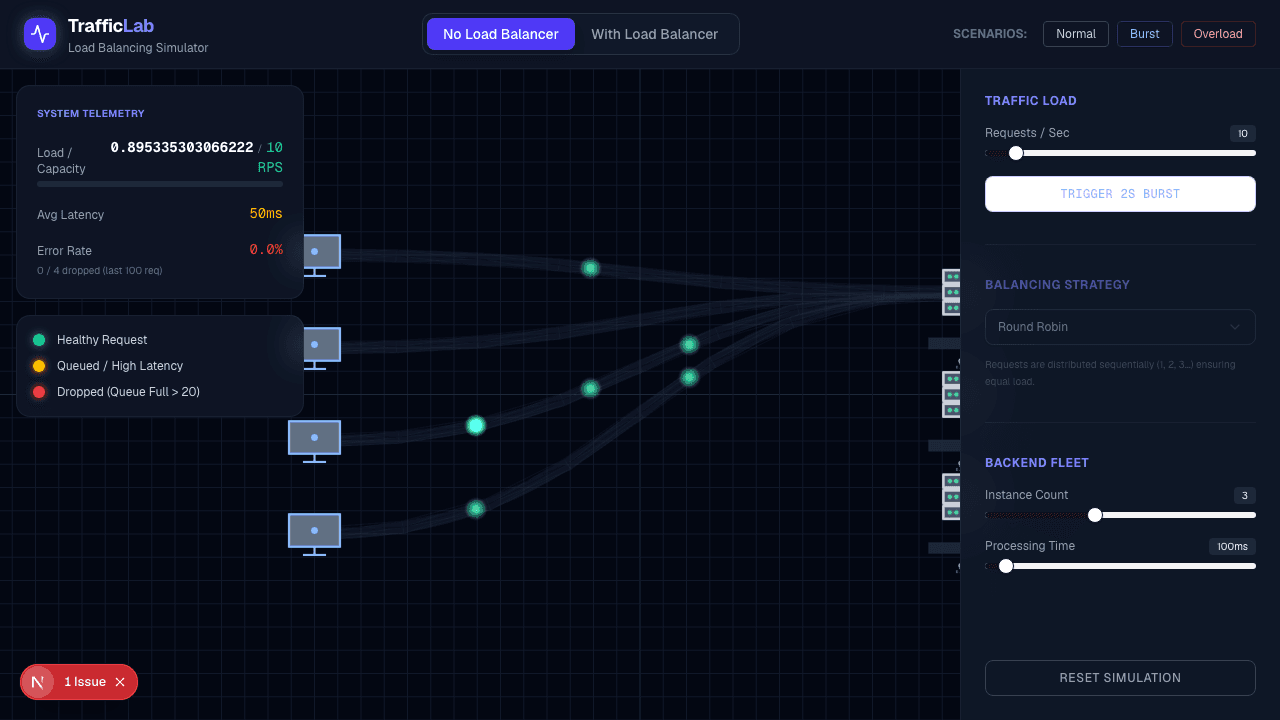
The live app is a single-page simulator labeled “TrafficLab — Load Balancing Simulator.” Users can switch between “No Load Balancer” and “With Load Balancer,” choose Normal, Burst, or Overload scenarios, adjust requests per second, trigger a two-second burst, change backend instance count, adjust processing time, and reset the simulation.
The telemetry panel shows load and capacity, average latency, error rate, and dropped requests over the last 100 requests. Colored request indicators explain state: green for healthy requests, yellow for queued or high-latency requests, and red for dropped requests when the queue is full above 20.
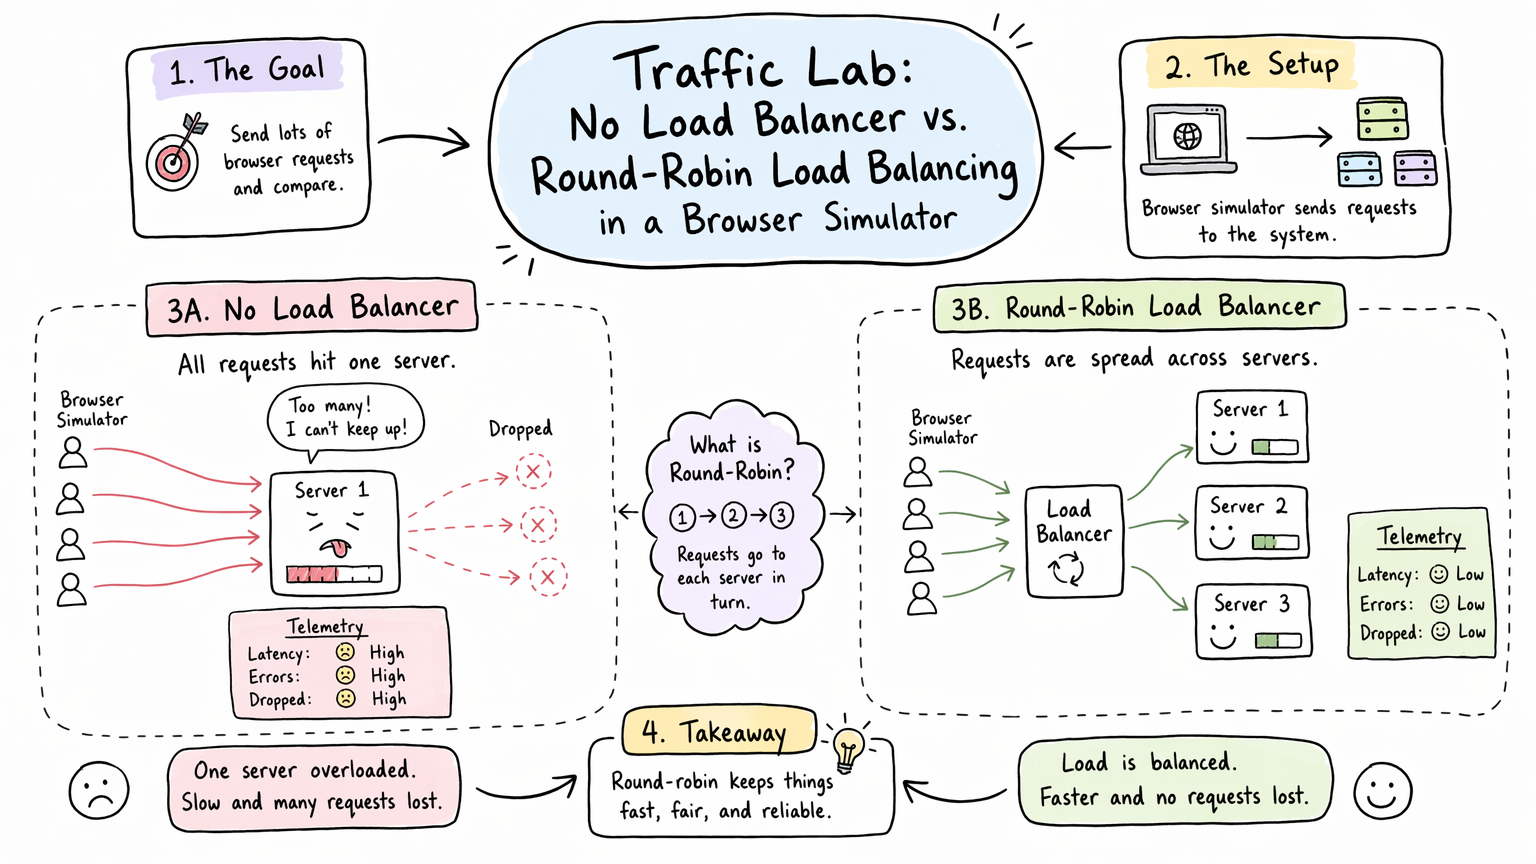
The comparison I’m teaching: one backend taking all traffic versus a simple round-robin balancer spreading pressure across a fleet.
Technical shape
Public evidence supports describing Traffic Lab as a browser-based, client-side simulation. The live UI presents request flow and telemetry without visible server or API behavior.
The visible load-balancing strategy states that requests are distributed sequentially across instances, which matches a round-robin-style explanation. Because there is no public source URL in portfolio data, I do not claim a specific framework, state library, rendering model, or simulation loop.
What happens to one request
I added the comparison view because it is easy to talk about load balancing as an abstract “spread the traffic” idea. The simulator gets more useful when you track what happens to one request under pressure: whether it gets assigned, waits, finishes slowly, or gets dropped.
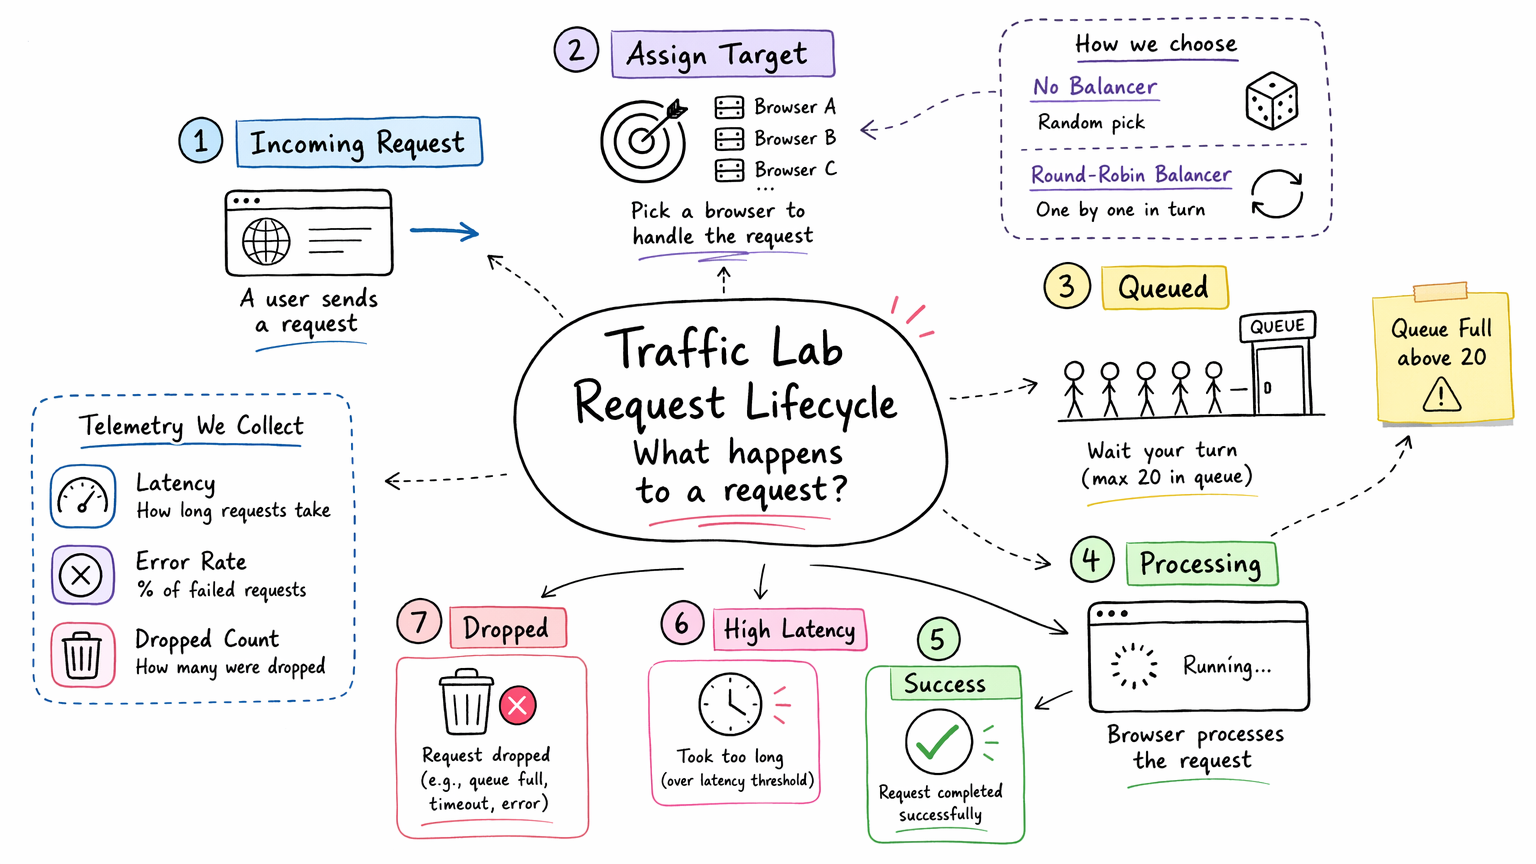
The lifecycle I wanted to make visible: a request is not just successful or failed; it can be queued, delayed, processed, or dropped depending on capacity and routing mode.
That is why the telemetry is simple on purpose. Load/capacity, latency, error rate, and dropped requests are enough to explain the difference between normal traffic, burst traffic, and overload without turning the page into a full observability product.
Key implementation decisions
- I kept the simulator narrow: compare no balancer with a sequential balancer instead of modeling every algorithm.
- I made overload visible through latency, error rate, and dropped-request counters.
- I used scenario presets so users can move quickly from normal operation to stress cases.
- I exposed instance count and processing time because capacity depends on fleet size and service speed, not only traffic volume.
Current status
Traffic Lab is an active live project with no public source URL in the portfolio data. Live exploration found a focused single-page simulator with no visible subpages or documentation pages.
I keep the article focused on visible simulator behavior and controls, not internal implementation details.
What I would improve next
I would add short explanations beside each scenario, include more strategies such as random or least-connections if the simulator expands, and add shareable scenario parameters. A small model-assumptions panel would also make the queue size and processing rules clearer.