
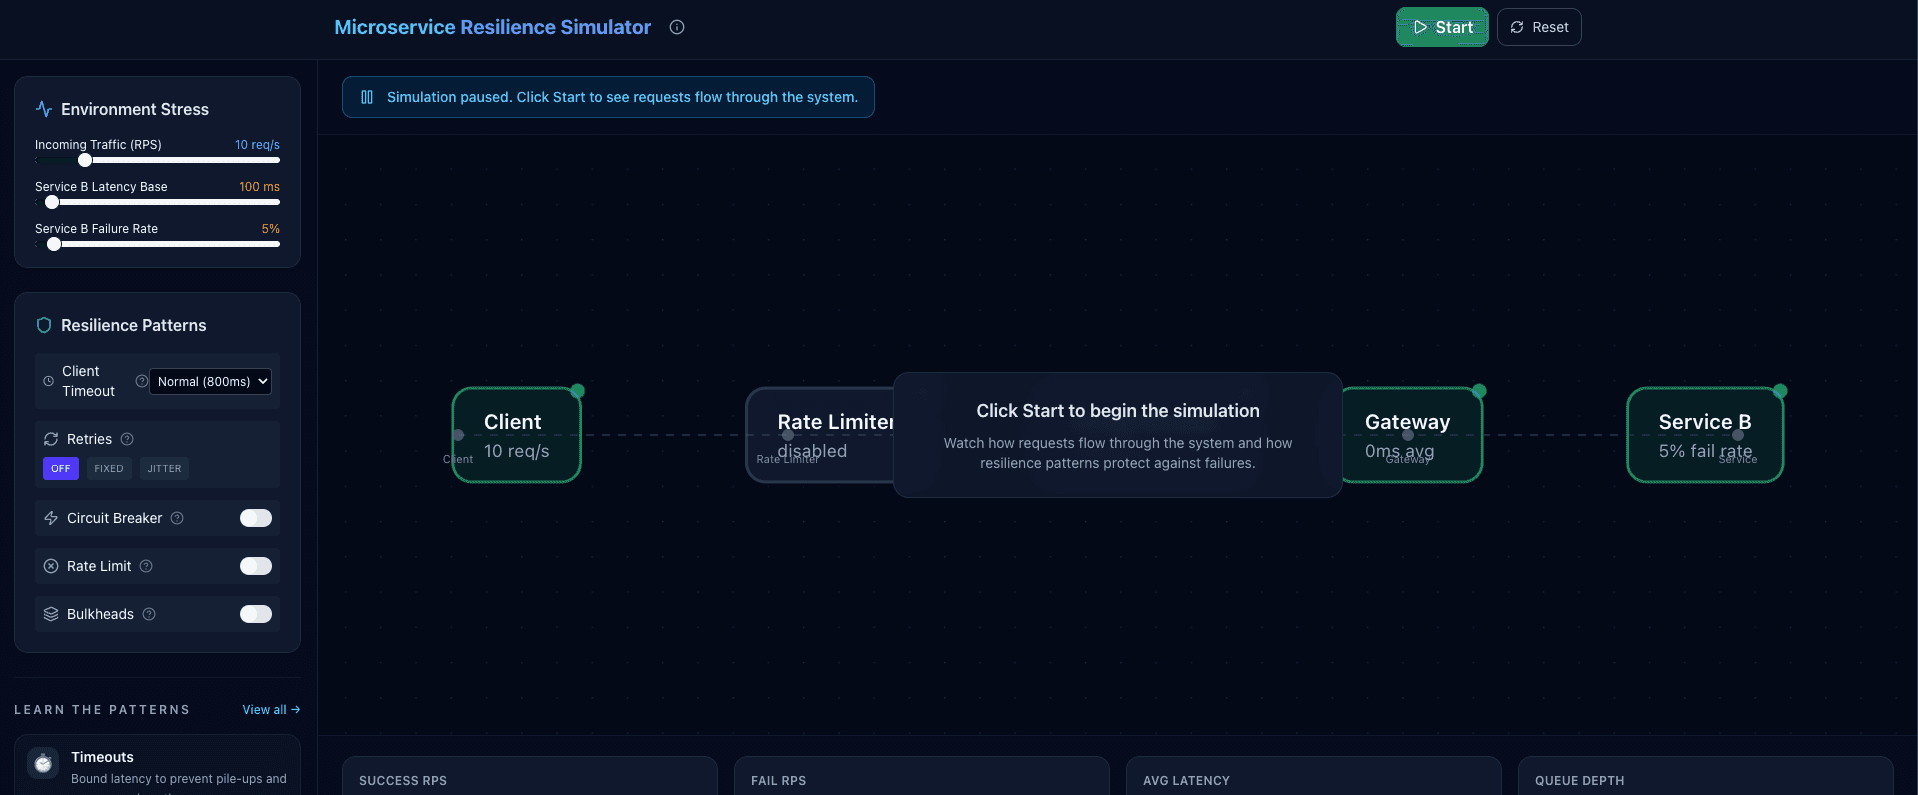
Microservice Resilience Simulator
An interactive Next.js resilience lab that visualizes retry storms, latency, queue depth, circuit breakers, rate limits, and bulkheads under load.
Stack
Tags
Why I built it
I built the Microservice Resilience Simulator because resilience patterns are often taught as static diagrams, but the interesting behavior appears when traffic, latency, failure rate, retries, and queue depth interact over time. I wanted those interactions to be visible in the browser.
I built it as a teaching tool for distributed-systems concepts. I do not present it as a real distributed system, and I do not describe it as production network simulation.
What it does
Users can adjust incoming RPS, Service B latency, and Service B failure rate. They can toggle timeouts, retry style, circuit breaker, rate limiting, and bulkheads, then watch metrics such as success RPS, fail RPS, average latency, queue depth, and circuit-breaker state.
The live app also includes throughput, error, and latency charts, plus an interactive topology canvas with animated request flow. A /learn/patterns page lists five resilience patterns: Timeouts, Retries, Circuit Breaker, Rate Limiting, and Bulkheads.
Technical shape
Repository evidence shows a Next.js App Router frontend written in TypeScript. I kept the simulation engine framework-agnostic at simulation/resilience/engine.ts. React orchestration runs through hooks/use-resilience-simulator.ts using requestAnimationFrame, while Zustand state lives in hooks/use-resilience-store.ts.
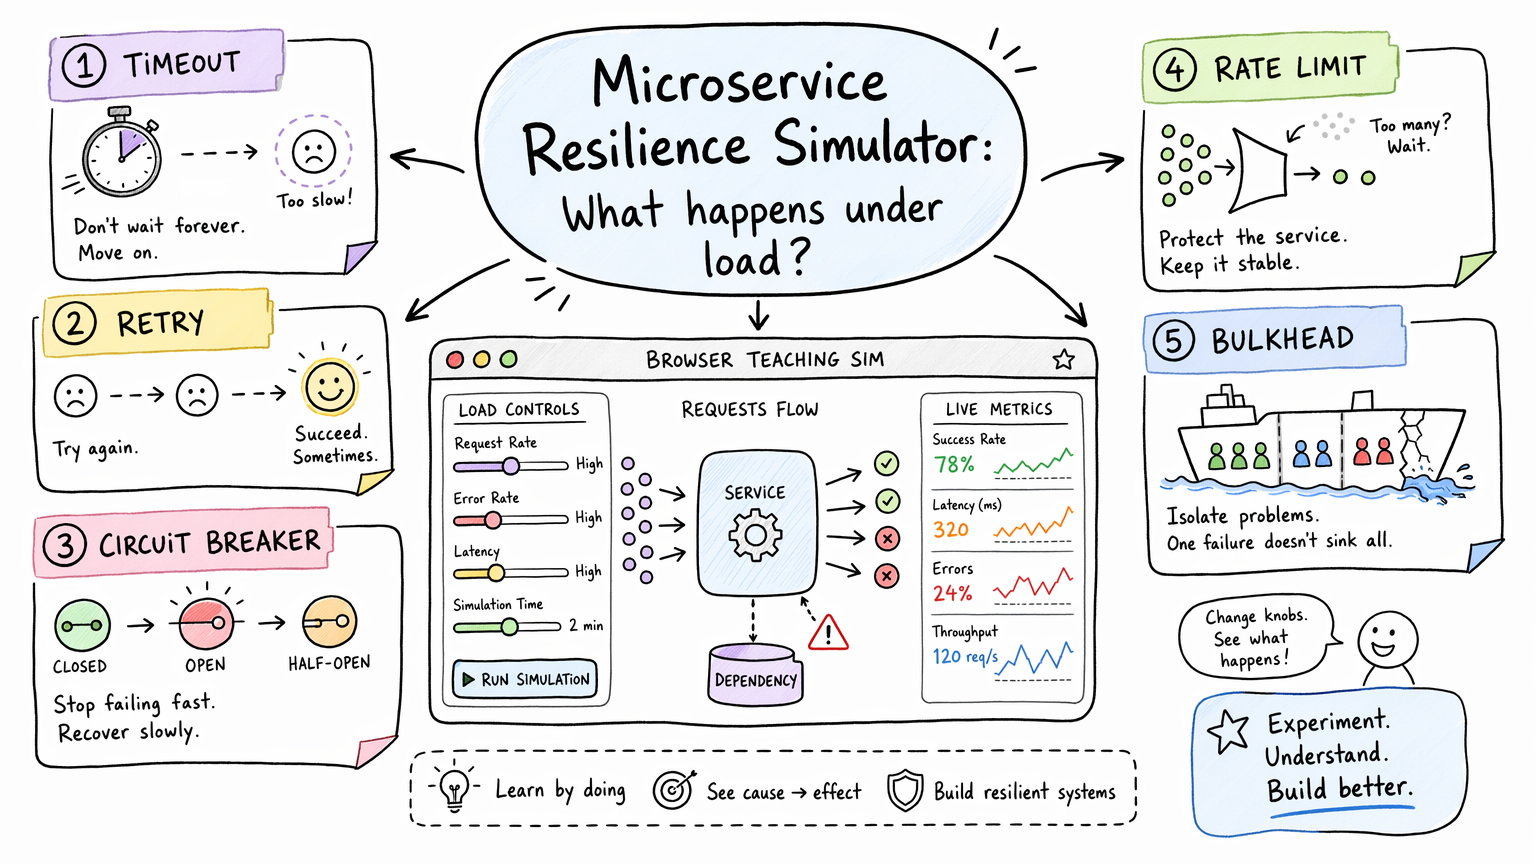
I separated the simulation model from the React UI so the lab can show failure behavior without pretending to be a real distributed system.
I used ReactFlow for the topology visualization in components/resilience/hero-flow.tsx. Request motion is represented through a canvas particle overlay in components/resilience/request-particles.tsx. Metrics and charts are split into resilience metrics, charting, and status components. The repo also includes an MDX + Mermaid content system under content/guides/ and a lib/mdx.ts loader.
The state transition I wanted people to feel
The circuit breaker is the best example of why I built this as a simulator instead of a static article. The useful lesson is not the definition of closed, open, and half-open. The useful lesson is watching retries and failures push the system into a different state.
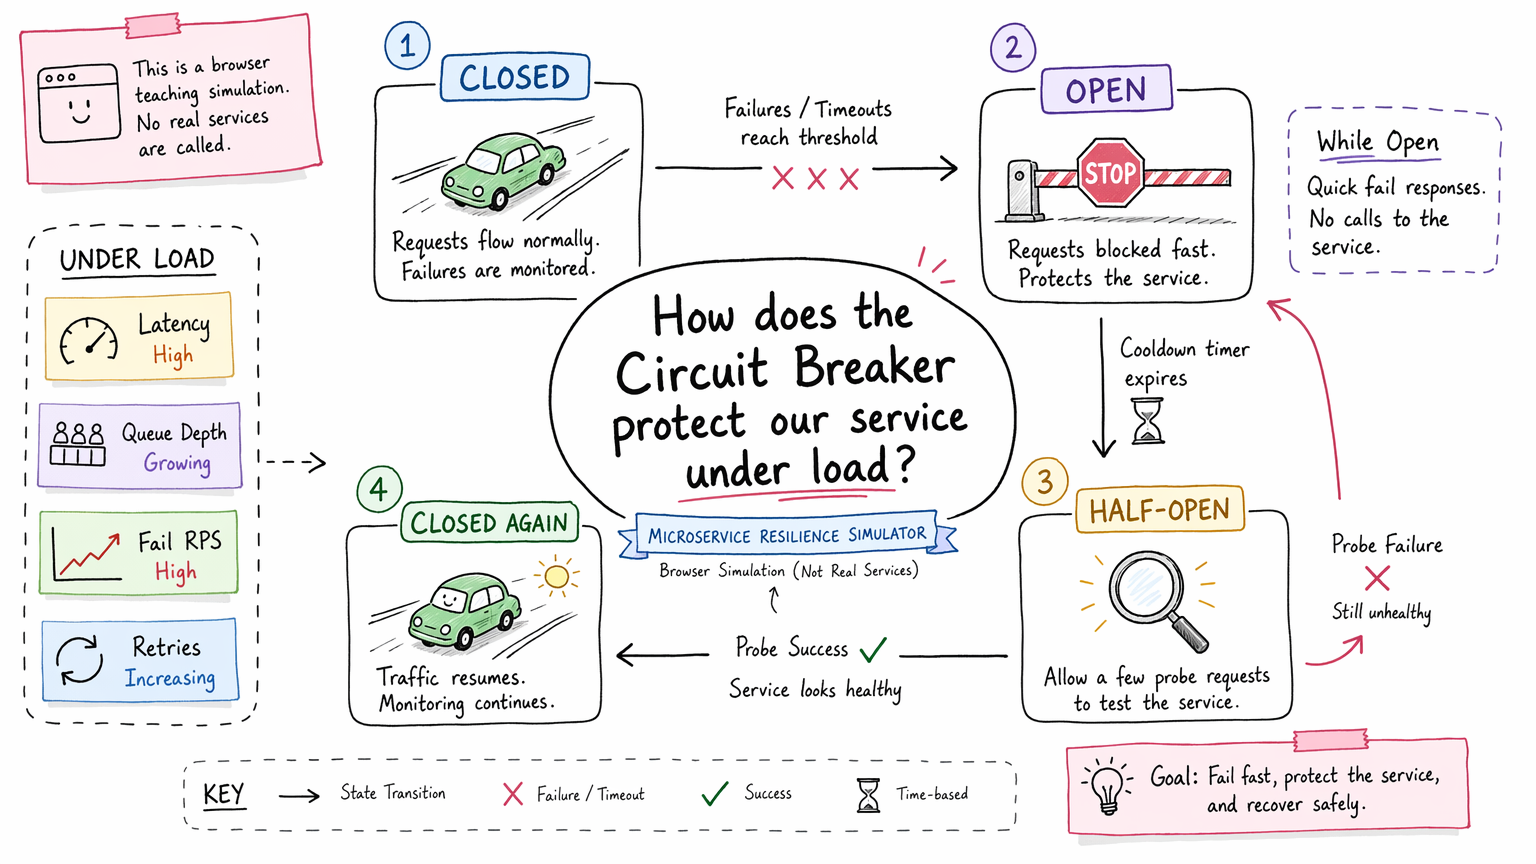
The state machine I wanted to make visible: failures trip the breaker open, cooldown allows a probe, and the next result decides whether traffic resumes or stays blocked.
When that transition is tied to queue depth, failed RPS, latency, and request animation, the pattern becomes easier to reason about. The UI is not decoration here; it is the teaching surface.
Key implementation decisions
- I kept the model local and visual instead of emulating real network calls.
- I ran updates with
requestAnimationFrameso simulation changes align with browser rendering. - I separated the simulation engine from React UI state so behavior is easier to reason about.
- I used ReactFlow for topology and canvas particles for motion, keeping graph structure and animation separate.
- I exposed pattern toggles so users can compare before and after behavior.
Current status
The simulator is active with a live site and source repository. Live exploration confirmed the simulator and /learn/patterns listing page.
Individual pattern detail links were visible from the pattern listing, but those detail routes returned 404 during research. That makes the listing real, while the linked deep-dive pages should be treated as incomplete.
What I would improve next
I would ship the individual pattern detail pages, add preset scenario buttons for common demos, and include a visible “model assumptions” panel near the controls. Exportable snapshots would also help users compare configurations without relying on memory.